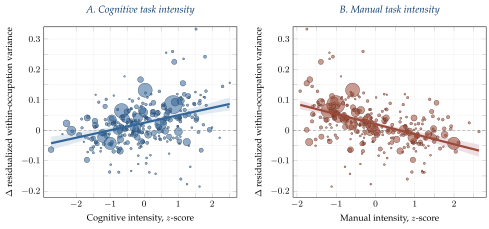
 Figure 1. Changes in within-occupation inequality by task intensity, 1980 to 2010 interactive
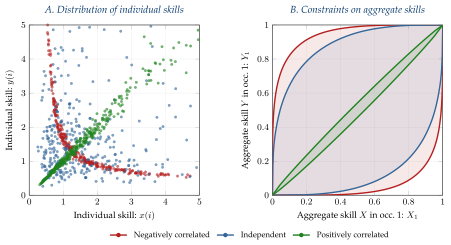 Figure 2. Distribution of individual skills and aggregate bundling constraints
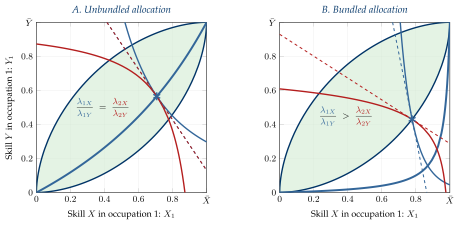 Figure 3. Unbundled and bundled allocations
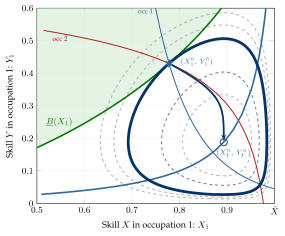 Figure 4. Geometry of the solution when the bundling constraint binds
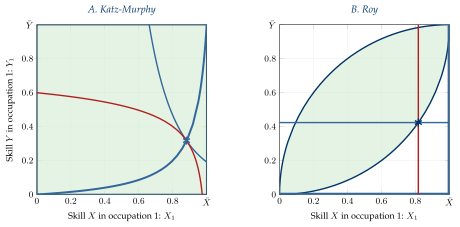 Figure 5. Special cases: Katz-Murphy and Roy
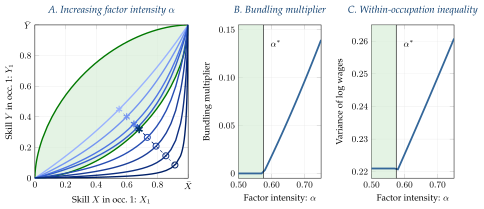 Figure 6. Increasing factor intensity \(\alpha\) and within-occupation wage inequality
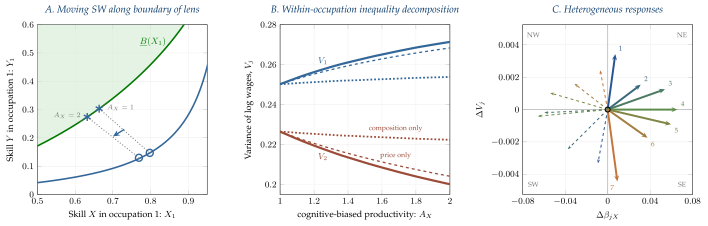 Figure 7. Cognitive-biased technological change and within-occupation wage inequality
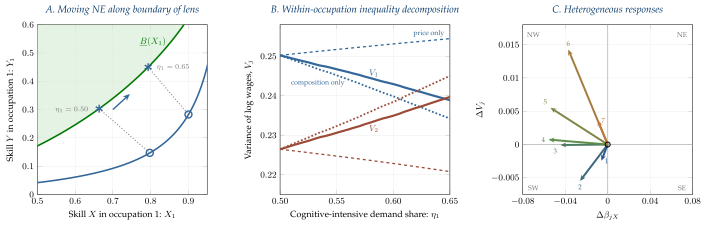 Figure 8. Cognitive-biased demand shifts and within-occupation wage inequality
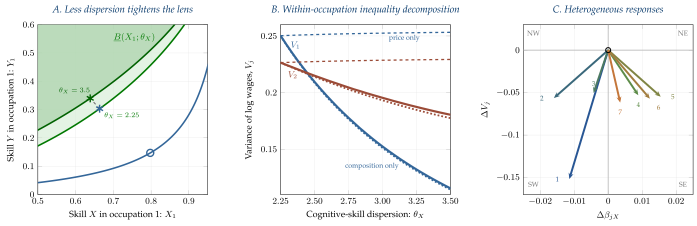 Figure 9. Reduced dispersion of cognitive skills and within-occupation wage inequality
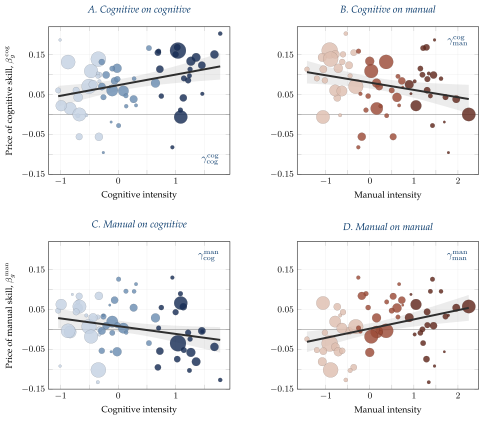 Figure 10. Skill prices across occupation groups in the NLSY79 interactive
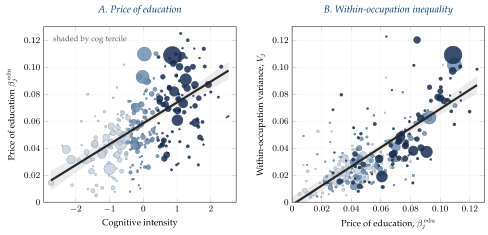 Figure 11. Skill prices and within-occupation inequality across occupations, 2010 interactive
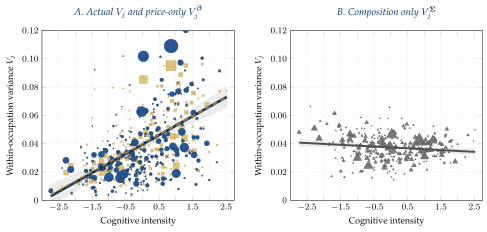 Figure 12. Decomposing within-occupation inequality: prices vs. composition, 2010
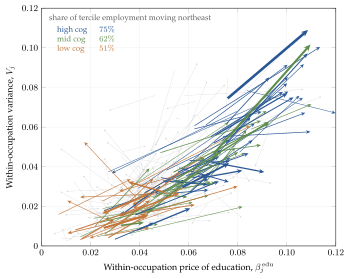 Figure 13. Occupation trajectories, 1980 to 2010 interactive
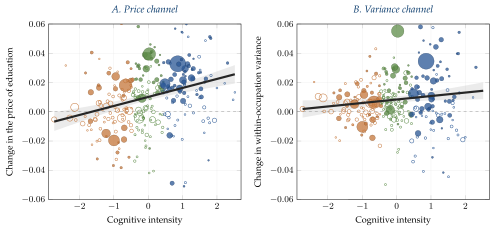 Figure B.1. The two dimensions of displacement, 1980 to 2010 interactive