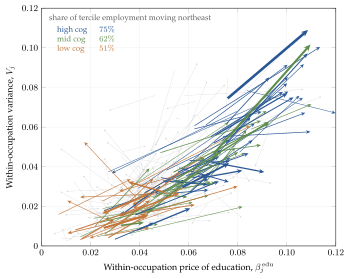
Each arrow is the trajectory of an occupation’s price of education \(\beta_{j}^{\rm edu}\) and its within-occupation variance \(V_{j}\) from its 1980 position to its 2010 position. Occupations with statistically significant changes in the price of education \(\beta_{j}^{\rm edu}\) from 1980 to 2010 are colored. The remaining occupations are shown as fine light grey arrows. The arrows are colored by tercile of cognitive intensity (low, orange; middle, green; high, blue), and arrow width is proportional to 1980 occupation employment. The inset reports the share of each tercile’s employment that moved to the northeast, with both the education price and within-occupation variance rising. Pooled across all occupations, changes in the northeast (NE) direction with both rising skill price and rising inequality account for \(62\%\) of employment. Changes in the southwest, northwest and southeast directions account for 13%, 16% and 9% of employment respectively. For visual clarity the axes are clipped to the employment-weighted 1st–99th percentile of the plotted variables. About 1.7% of employment lies outside this frame but is retained in all calculations. Census 1980 and ACS 2010, \(J = 286\) occupations observed in both years.
In the paper: Figure 13. Occupation trajectories, 1980 to 2010.