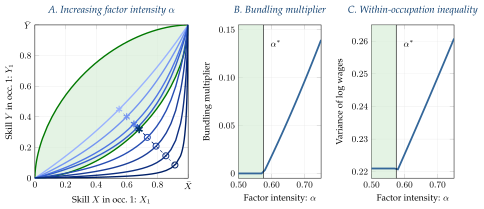
Panel A shows the feasible set \(\mathcal{B}\) and contract curves as factor intensity \(\alpha\) increases, with asterisks marking the equilibrium allocation. For \(\alpha \leq \alpha^*\) the equilibrium is unbundled and the allocation moves southeast. For \(\alpha > \alpha^*\) the equilibrium is bundled at the boundary \(\underline{B}(X_1)\) (fixed asterisk \(\boldsymbol{*}\)) while the unconstrained optimum drifts further outside \(\mathcal{B}\) (open circles \(\circ\)). Panel B shows the bundling multiplier \(\mu(\alpha)\), zero in the unbundled region and increasing in the bundled region. Panel C shows the within-occupation variance of log wages, flat for \(\alpha \leq \alpha^*\) and rising for \(\alpha > \alpha^*\). The green shaded region indicates \(\alpha \leq \alpha^*\). Parameters: independent Fréchet marginals with \(\theta = 2.25\), CES production with \(\sigma = 0.60\), symmetric economy with \(\eta_1 = \eta_2 = 0.5\) and \(\overline{X}=\overline{Y}\).
In the paper: Figure 6. Increasing factor intensity \(\alpha\) and within-occupation wage inequality.