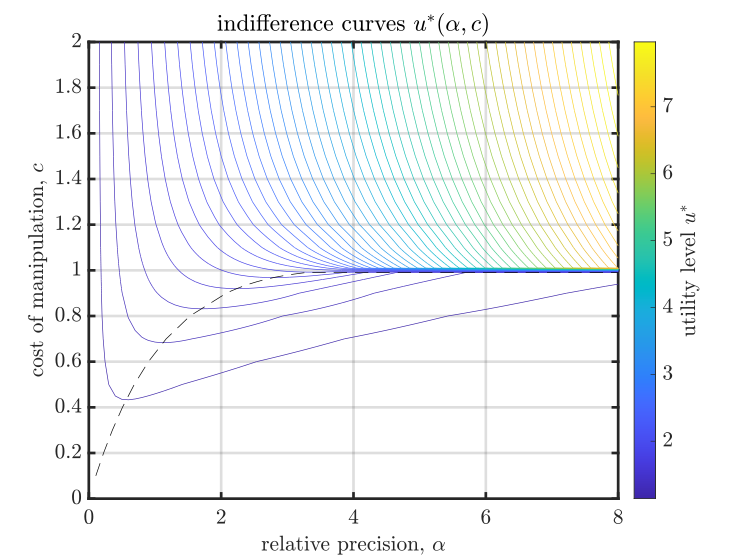
Citizens’ indifference curves \(u^*(\alpha,c)\) with warmer colors indicating higher utility. For \(c>1\), higher \(\alpha\) increases the citizens’ utility. For \(c<1\) and \(\alpha>\alpha^*(c)\), higher \(\alpha\) decreases the citizens’ utility. For \(\alpha>4\) the citizens’ utility jumps discontinuously at the critical threshold \(c=1\). The levels of utility with \(\alpha>4\) and \(c>1\) cannot be reached from any \(c<1\).
In the paper: Figure 6. Citizens’ indifference curves \(u^*(\alpha,c)\)..