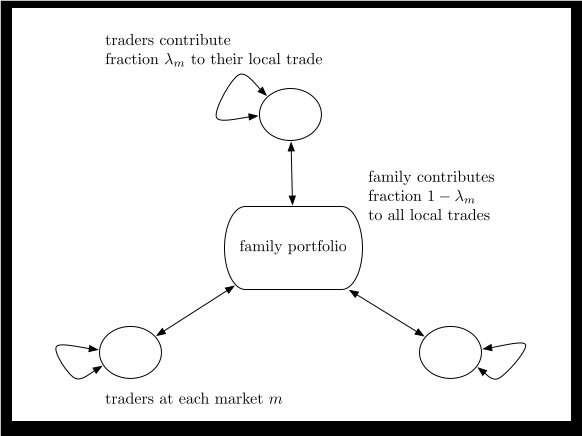
 Figure 1. Segmentation frictions
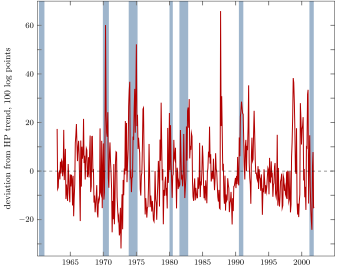 Figure 2. Cross-sectional standard deviation of stock returns
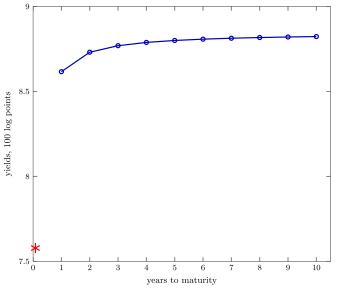 Figure III. Average yield curve (annualized)
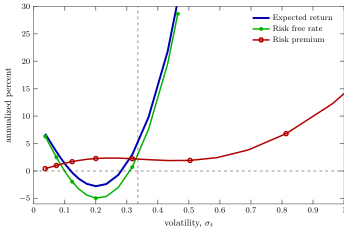 Figure 3. Conditional returns
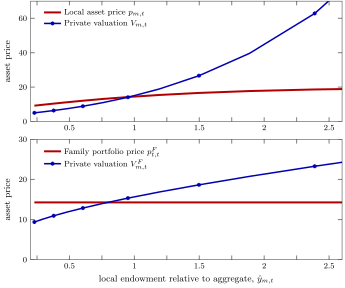 Figure 4. Implementation of family trades
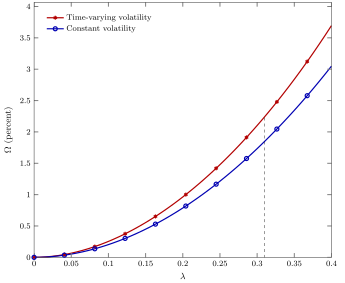 Figure 5. Welfare costs of segmentation
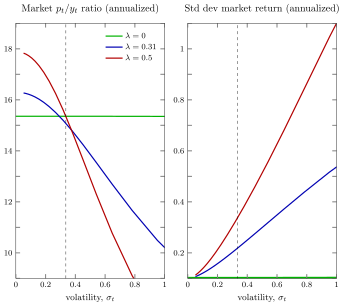 Figure I. Conditional moments
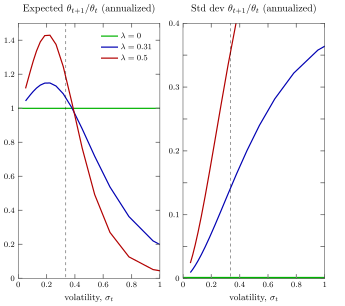 Figure II. Multiplicative bond-pricing factor \(\theta_{t+1}/\theta_t\)
Aggregate Implications of Micro Asset Market Segmentation